"gplot" command
Purpose
For displaying and analyzing output of simulation graphically in a separate window.
Syntax
gplot mode points
gplot mode points parameters
Status
Currently you can plot the stored probe data by choosing corresponding mode and points.
You can customize the plot by setting proper options or by providing appropriate parameters.
Comments
The 'gplot' commands display the selected points on separate window unlike the previous “plot” command which shows plot on same terminal. 'Store' command in combination of 'gplot' command is used for plotting. To plot the output follow three simple steps:
1. store the probe by using 'store' command (preferably store mode v(*) or whatever way you like).
2. Run simulation.
3. Use 'gplot' command with current simulation mode and points.
If window corresponding to given title (by default title=simulation mode) already exist click on that window tab to get the waveform. If you uses entirely new title then click on “new” button present in toolbar to get the waveform.
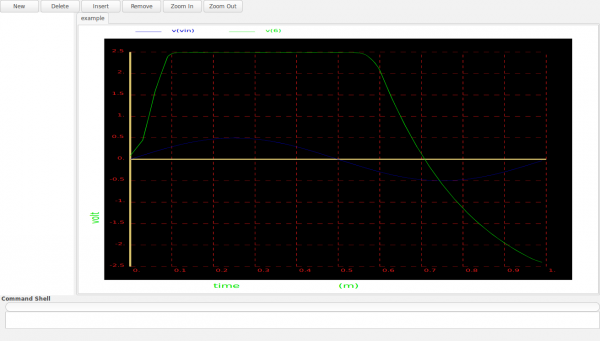
Use optional parameters along with 'gplot' to customize your plot. Provide title to the window by using option “title” with 'gplot'.
gplot tran v(1) v(2) [title="xyz" ... ]
Similarly you can provide label for axes, range of axes(to do), type and number of grids, grid step size(to do), and save output waveform as png file by providing otuput file name.
To modify existing window use the same title with desired points and parameters.
If you wants to zoom in or zoom out, select the zoom button from toolbar and click on the point around which you wants to zoom. You can also reset the view to original one by using “Reset” button.
Examples
store tran v(*)
tran start stop step
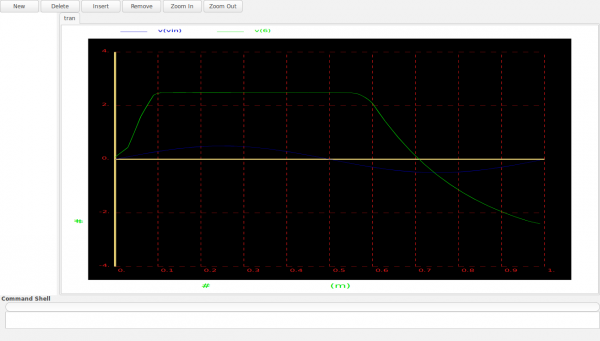
gplot tran v(vin) v(6)
A magnitude plot of input voltage and node 6 with a range of start to stop for transient analysis.

gplot tran v(vin) v(6) [title=example labelx=time labely=volt ngrid=10 saveplot=tran_example ]
Checklist
Done:
1.Basic plot plugin: Use data stored in wave object and plot it out graphically.
2.Feature list:
Title
Axes labels
Number of grids
Saveplot as png file
Linear and logarithmic grid
X-axis limit
Zoom functionality
TO DO:
1.Improving logarithmic plot
2.Appending new features in feature list.
Y-axis limit
Grid step size
Polar grid
Smith grid
3.Wave processing: By using command from terminal user will be able to do simple maths on waveform.
e.g gplot dc v(1)+v(2)...
    gplot dc 2*v(1)-.7/2.1k
4.Implementation of menu bar.
5.Implementing functionality of command shell of displayer.
6.Running displayer as a standalone program.
